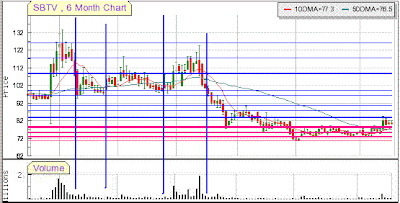
Let us analyze one by one. Breakout When a stock moves past a very strong resistance price, it is termed as a Breakout. Breakouts can be at least of two types.
Real Breakout. This happens when a stock breaks out off the last know major/minor Resistance.
Minor Bullish Breakout. This happens when a stock has been in a tight trading range and it breaks past this range. The difference between this and a real breakout is, in this case, we still have some/many minor/major resistances above. But we have broken past a tight trading range. Following are the Characteristics/features of a Breakout.
Breakouts generally happen on a huge volume. Usually 2-4 Times the average volume.
At a minimum, a breakout results in 10-15% gain. And it could go as much as 100%. Of course it takes its own time. But both cases are very much possible and happen almost every month.
80% of the time, after a breakout, price of the stock comes very near/close to the price where it originally broke out from. This is known as testing the breakout and flushing out weak hands. This also creates an impression that the breakout was NOT real and questions the same. But under almost all circumstances, the price picks back up after this test is over.
The More number of times a stock tests it's breakout resistance, the better it's chance of breaking out. For example. If a stock tests the upper resistance only once, the next time it tests this resistance price, the chances of breakout is less. But if a stock tests a breakout resistance price, say 3-4 times, the next time it tests this price the chances of a Real breakout are very very high. And in such cases, the yield too is at least 20-25%. Let us take a Stock from US markets to show a good Real Breakout. TALK, Talk America holdings. Let us review it.
Early January 2005, it tested the $6.55 very first time. Could Not break past it.
Early Feb 2005, it re-tested the $6.55 second time. Could not break out.
Early March and April 2005, it tested this price another 3 times. Could not break out.
In Mid April, TALK finally Talked. Price broke past $6.55 on more than 3 times the average volume. And a decent gain of nearly 50% within a span of 2 weeks. If you had waited longer, ie, until today, you would have been at a profit of nearly 55%. So, as you can see. Talk tested $6.55 5 times and it broke out the 6th time and never looked back. Though all stocks may not fall in this category, the underlying theory remains the same. Take a look at TALK Chart below.

---------------------------------------------------------------------------------------
Similar to Breakouts, breakdown is just in the opposite direction. A Breakdown happens when a stock price moves past the last know Support price. The features of a Breakdown are very similar to that of a breakout and hence we do not wish to elaborate the same again. We shall consider "Sri Adhikari Brothers" from Indian market for this example. Take a look at the chart below.
In Mid of Jan, the stock tested the then major support price of about 98 a couple of times. Could not breakdown.
In late Feb 2005, the stock again tested this price and did Not breakdown.
In mid of March 2005, though, the stock tested this price and broke down. Within the next 2 weeks it dropped down nearly 20%. And to nearly 27% in a few more days.
The only other feature about a breakdown is that you may or may not have a huge volume. Breakdowns generally do happen without volumes as well.
So, to sum up. Breakouts and breakdowns are a good play for short term. But you must use caution and play only with appropriate stops.
Earlier Articles:
Technical Analysis & Decision Making . . . . Support/Resistance Level and It's importance . . . . Trading System . . . . Fibonacci Retracements And How to Benefit From It . . . . MACD Indicators . . . . Crossovers-Bullish & Bearish . . . . Stock volume & It's Importance
Source: stocks.dlngroup.com
Trading Secrets - High Low Breakout Technique
MACD Indicators
Internet Stock Trading – The Reality
Pivot Point Trading
Take stock of EVA when choosing shares
Double/Triple Tops n Bottoms
Trading with Grudge
Stop Loss, what to do
Crossovers-Bullish,Bearish
Volume & It's Importance
MACD Indicators
Breakouts and Breakdowns
Fibonacci Retracements
Trading System
Support/Resistance level
Technical Analysis & Decision making
======================================
MANAGING INVESTMENTS
Benefits of Investing Through Mutual Funds
What is a Mutual Fund?
Why to Invest ?
HOW TO SELECT SHARES FOR YOUR PORTFOLIO AN INTERES...
TISCO (Tata Steel)- TARGET 1115+
Quotes from Warren Buffett
Benefits of Investing Early
Evaluate your life insurance needs
The Secret To Making Crores ! - Compounding
Great Investor theory
Who all are the biggest winners in the market?- In...
Read Before Investing
The Great Investor Theory
Good Twenty stocks for 2008
Should you invest in index funds?
Billionaires bet big on India's bio-fuel
Investing for early retirement
Sensex target for 2008 at 22k-24k
Watch out for the Street signs- Is This As Good As...
